



Innovations
Expand Your Simulation Capabilities with Advanced Add-On Modules
Take your fluid dynamic and transient analyses further with our specialized add-on modules. Engineered to seamlessly integrate with your existing simulation software, these modules extend your core analytical capabilities to solve complex engineering challenges. Whether you need to automate multi-variable design optimization, model dynamic, time-dependent system behavior, analyze settling slurry transport, or automatically size piping networks for minimum cost, our advanced add-ons eliminate manual iteration and streamline your workflow.
Fathom Innovations


Fathom Highlights
Parametric Study Tool
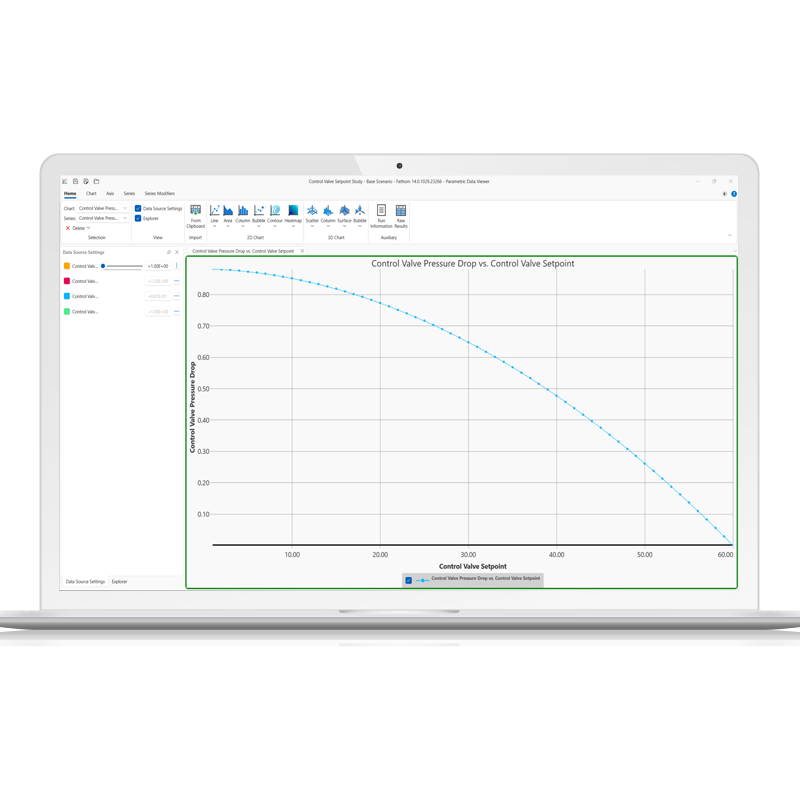
The Parametric Study tool enables rapid and in-depth simulation analysis, allowing users to explore a wide range of input parameters efficiently. By systematically varying inputs, the tool helps identify critical factors affecting system performance, enhancing sensitivity analysis and optimization. Engineers can gain clear insights through graphical trends, even in cases where traditional goal-seeking methods struggle. This approach facilitates better decision-making by providing visual justifications for key trade-offs, such as cost versus performance.
Fathom Highlights
Graph Annotations
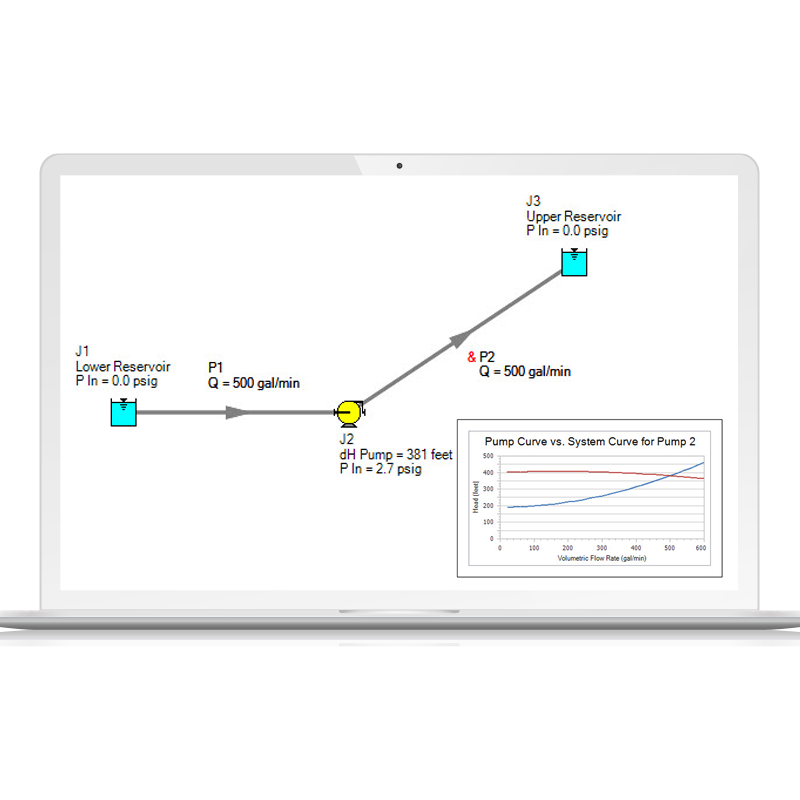
Graph Annotations is a new feature designed to enhance modeling workflows by allowing users to add auto-updating graphs directly to their Workspace. These graphs provide instant insights by visually comparing model results without requiring users to navigate elsewhere. Fully resizable, movable, and easily hidden, they function like Color Map layers, updating automatically based on Output data. By bringing the capabilities of the Graph Results tab to the Workspace, this provides a streamlined approach to reviewing key data, improving efficiency and decision-making.
Fathom Highlights
Scenario Comparison Layer
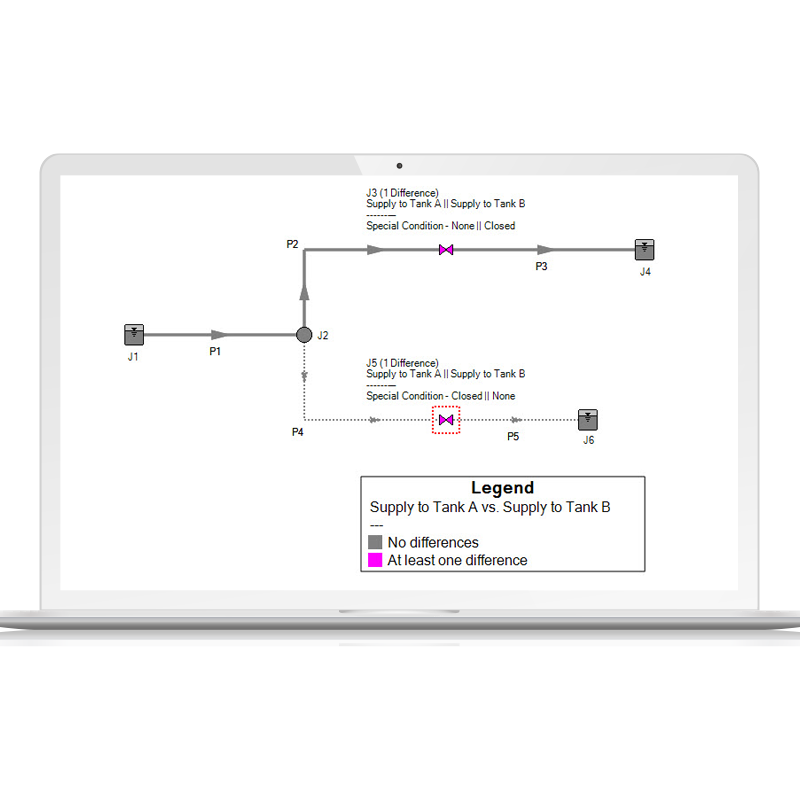
The Scenario Comparison Layer enhances clarity in scenario analysis by visually highlighting differences between the current scenario and a selected comparison scenario, whether explicitly chosen or related by one degree (Parent, Sibling, or Child). Objects with differences are color-coded on the Workspace, allowing users to quickly identify differences between the scenarios.
Fathom Highlights
Cross-App Heat Exchanger Thermal Link
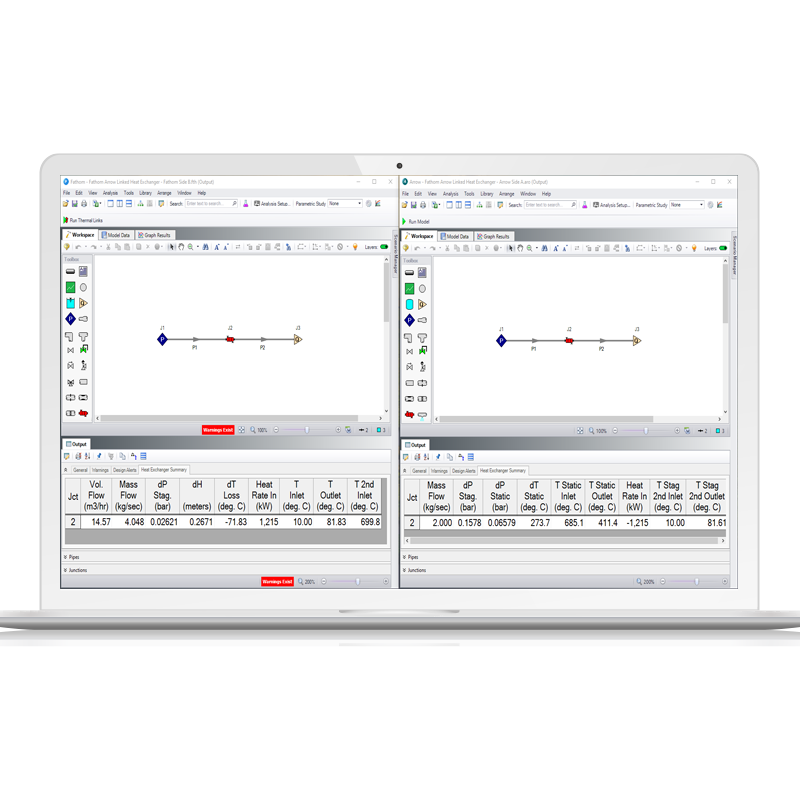
The new Cross-App Heat Exchanger Thermal Link feature in Fathom and Arrow streamlines the thermal analysis of liquid-gas heat exchangers by allowing direct thermal connections between heat exchanger junctions in gas (Arrow) and liquid (Fathom) systems. This integration enables both applications to run simultaneously until a converged solution is reached, eliminating the need for manual iterations. By automating this process, users can significantly reduce errors, complexity, and the time spent on iterative adjustments.
Arrow Innovations

Arrow Highlights
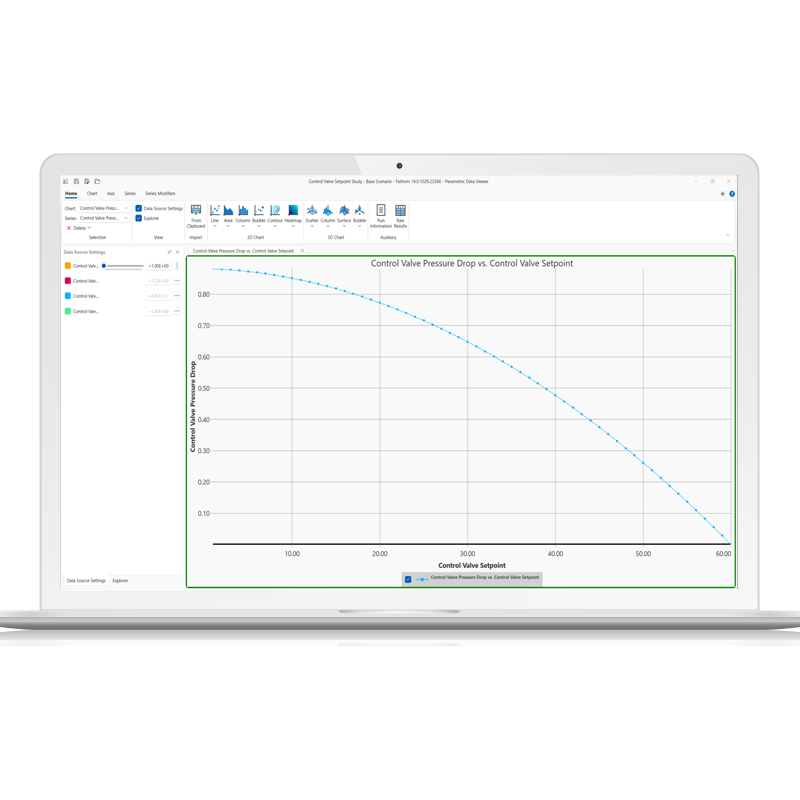
Parametric Study Tool
The Parametric Study tool enables rapid and in-depth simulation analysis, allowing users to explore a wide range of input parameters efficiently. By systematically varying inputs, the tool helps identify critical factors affecting system performance, enhancing sensitivity analysis and optimization. Engineers can gain clear insights through graphical trends, even in cases where traditional goal-seeking methods struggle. This approach facilitates better decision-making by providing visual justifications for key trade-offs, such as cost versus performance.
Arrow Highlights
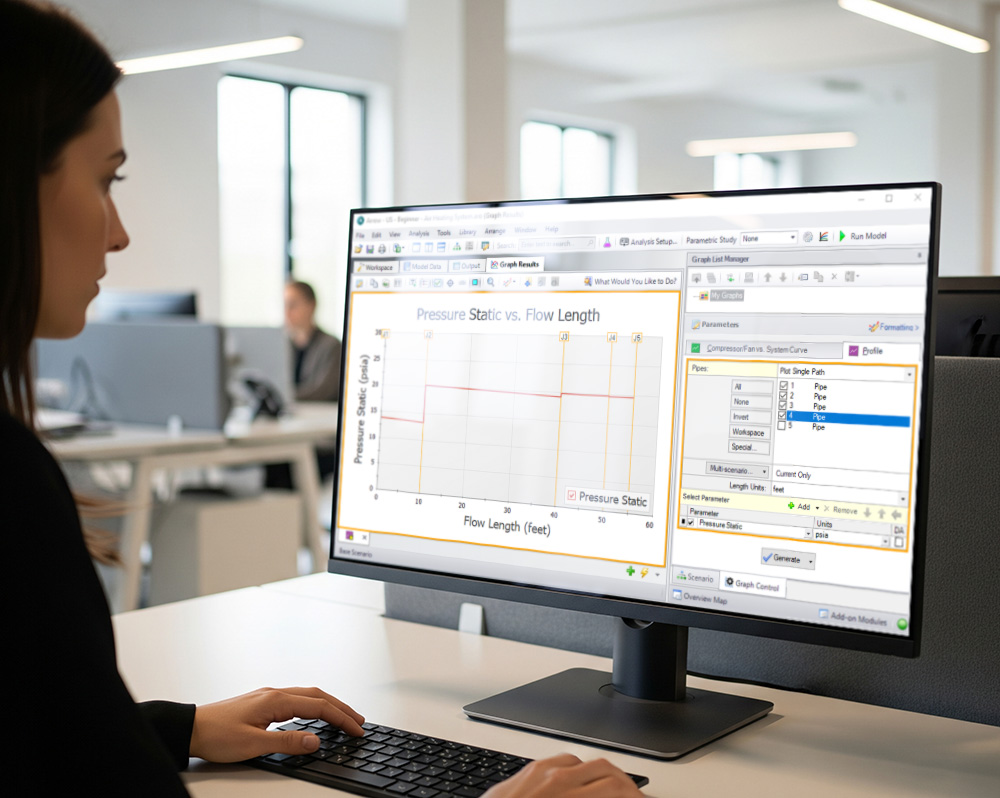
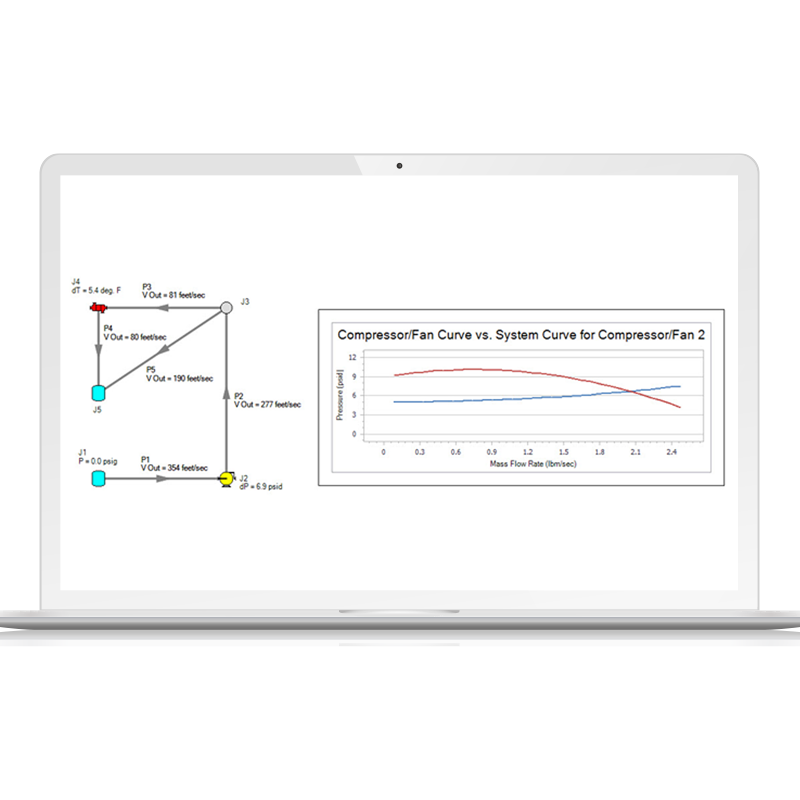
Graph Annotations
Graph Annotations is a new feature designed to enhance modeling workflows by allowing users to add auto-updating graphs directly to their Workspace. These graphs provide instant insights by visually comparing model results without requiring users to navigate elsewhere. Fully resizable, movable, and easily hidden, they function like Color Map layers, updating automatically based on Output data. By bringing the capabilities of the Graph Results tab to the Workspace, this provides a streamlined approach to reviewing key data, improving efficiency and decision-making.
Arrow Highlights
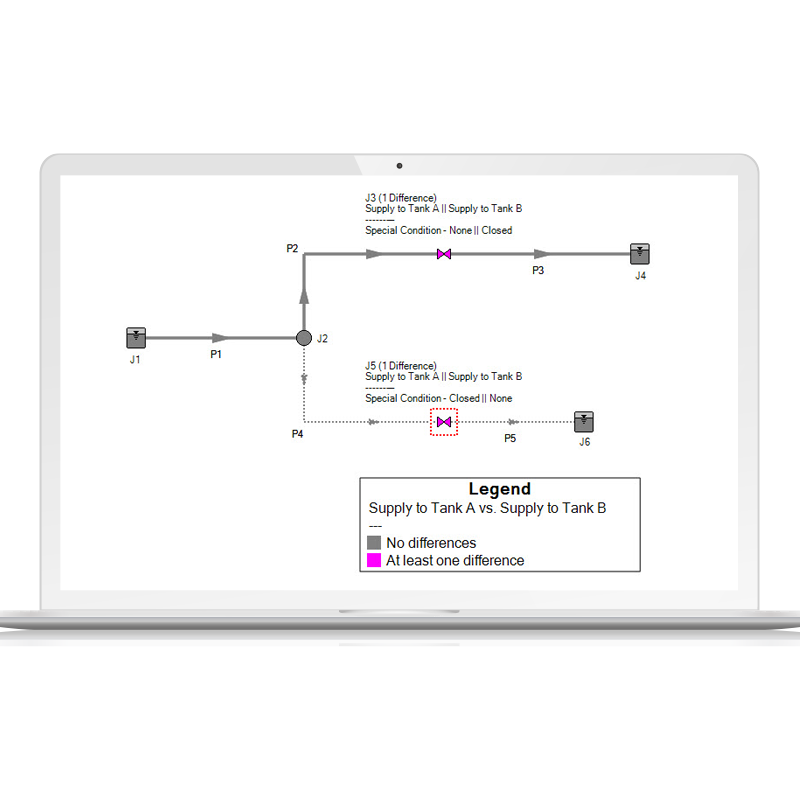
Scenario Comparison Layer
The Scenario Comparison Layer enhances clarity in scenario analysis by visually highlighting differences between the current scenario and a selected comparison scenario, whether explicitly chosen or related by one degree (Parent, Sibling, or Child). Objects with differences are color-coded on the Workspace, allowing users to quickly identify differences between the scenarios. Each modified object provides an easy way to inspect specific parameter and value differences through the object labels and the Inspection Window. This update delivers the capabilities of the Scenario Comparison Tool through a much more visually appealing and intuitive layer, streamlining the analysis process and improving user efficiency in interpreting complex models.
Arrow Highlights
Cross-App Heat Exchanger Thermal Link
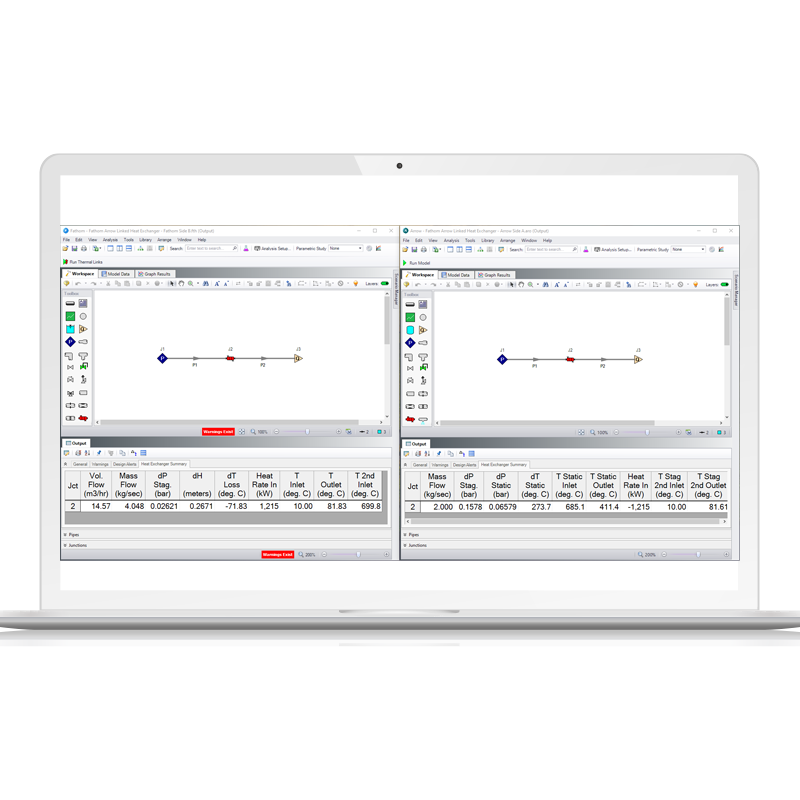
The new Cross-App Heat Exchanger Thermal Link feature in Fathom and Arrow streamlines the thermal analysis of liquid-gas heat exchangers by allowing direct thermal connections between heat exchanger junctions in gas (Arrow) and liquid (Fathom) systems. This integration enables both applications to run simultaneously until a converged solution is reached, eliminating the need for manual iterations. By automating this process, users can significantly reduce errors, complexity, and the time spent on iterative adjustments.
Impulse Innovations

Impulse Highlights
Pipe Filling and Draining
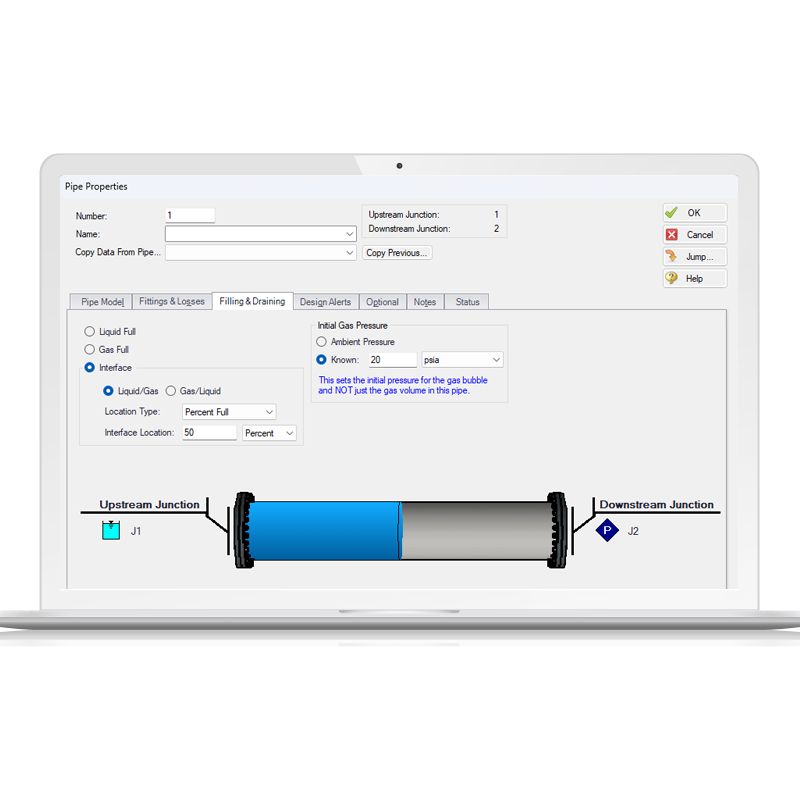
This feature tracks the propagation of multiple liquid-gas interfaces across a piping network. The liquid phase and the moving front are solved via the Method of Characteristics (MOC), while the gas phase is modeled as a lumped compressible volume. This hybrid approach accurately captures transient phenomena such as line draining, flow splitting, and trapped gas pockets, while fully resolving hydraulic surge effects in the liquid column.
Impulse Highlights
End Transient Run Feature
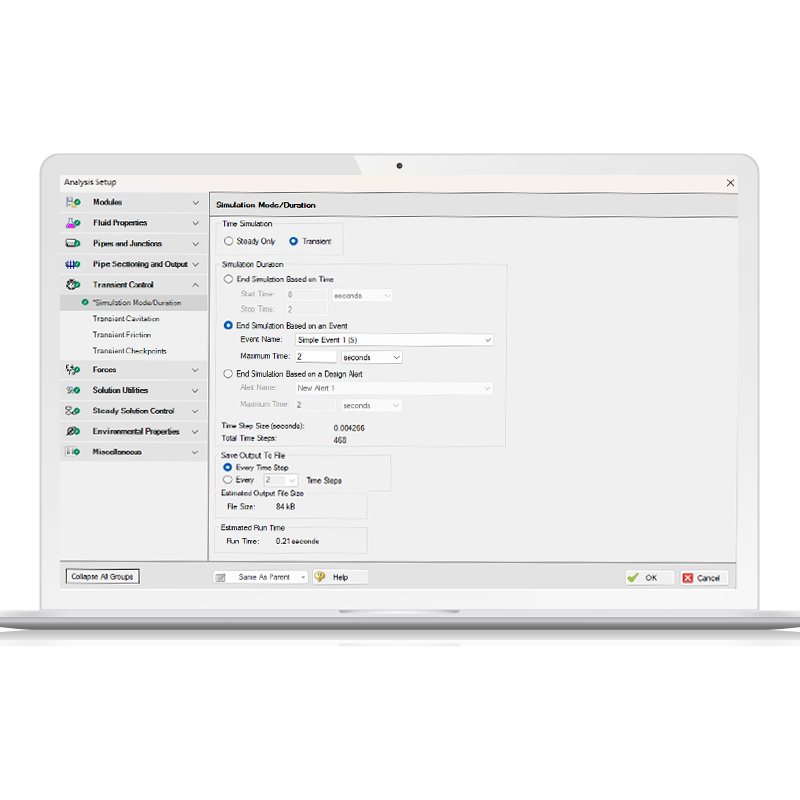
AFT Impulse and xStream now feature advanced transient simulation termination criteria, moving beyond fixed-time stops. Users can programmatically halt a run based on specific transient events or when a user-defined Design Alert is triggered (e.g., pressure exceeding a threshold in a given pipe). Upon an alert- or event-driven termination, the solver truncates the output file, generates a checkpoint file for seamless restarts, and logs an informational warning in the Message Manager.
Impulse Highlights
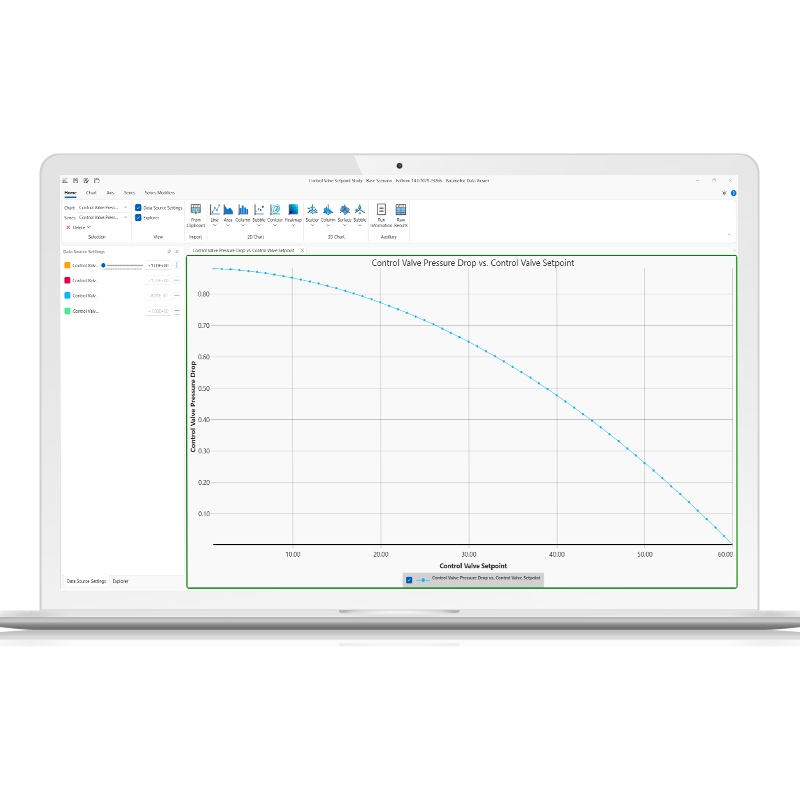
Parametric Study Tool
This tool streamlines transient and steady-state analysis through systematic input variation and automated scenario generation. It enhances sensitivity analysis by identifying dominant system variables, offering a robust alternative when standard goal-seeking methods struggle. Through graphical trend mapping, engineers can easily evaluate trade-offs, optimize operating envelopes, and pinpoint critical components for model calibration.
Impulse Highlights
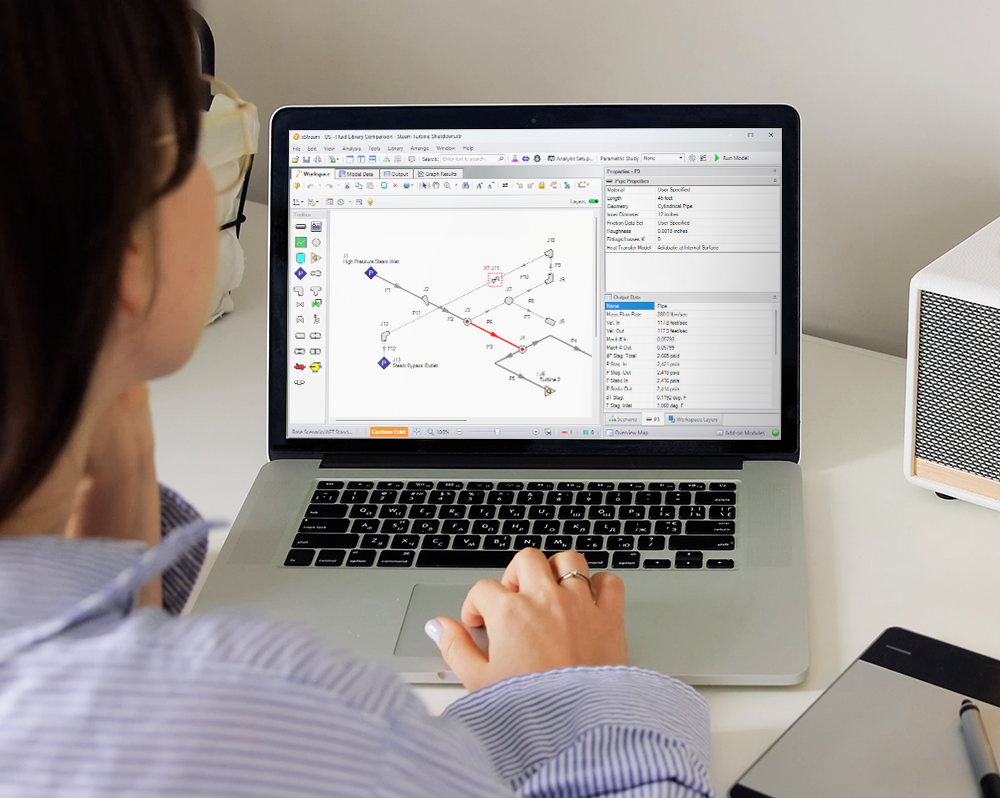
Graph Annotations
This feature integrates dynamic, auto-updating plots directly into the Workspace, streamlining model verification. These persistent, resizable graphical overlays allow for immediate comparison of simulation results without forcing the user to switch to the Graph Results tab. Behaving similarly to Color Map layers, Graph Annotations automatically sync and refresh whenever new Output data is generated. Users can easily instantiate a plot via the Toolbox, select the target parameters, and embed it into the schematic. This reduces post-processing clicks and accelerates iterative design analysis.
xStream Innovations

xStream Highlights
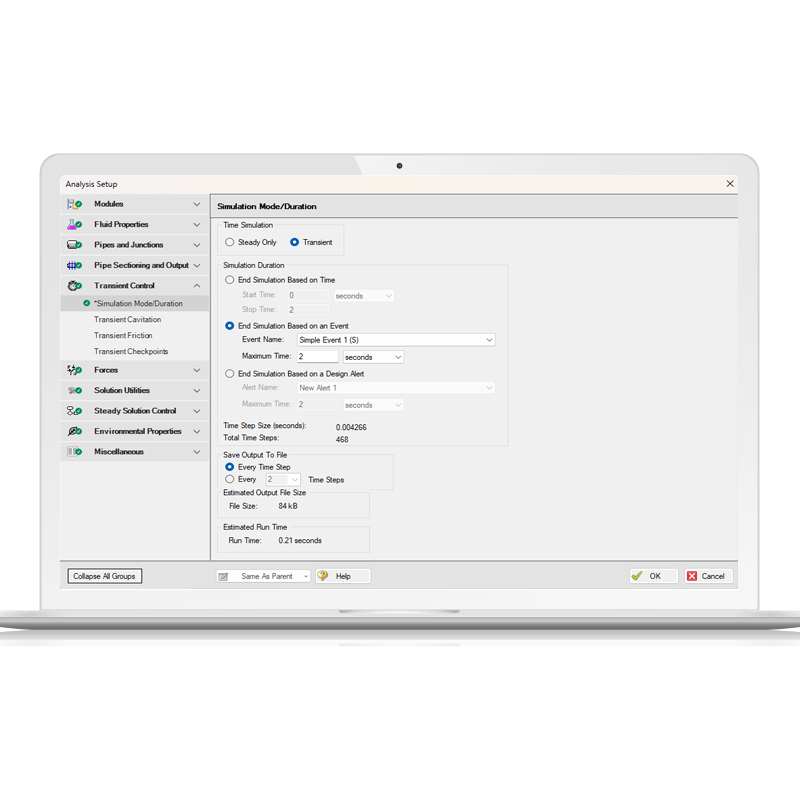
End Transient Run Feature
Impulse and xStream now offer more flexible ways to end a transient simulation, with new options that go beyond stopping at a predefined time. In addition to time-based termination, users can now choose to halt a run when a specific transient event occurs or when a user-defined Design Alert is triggered. Design Alerts, which typically highlight when a pipe or junction reaches a set condition—such as “If the pressure exceeds X in pipe Y”—can now be used to stop the simulation entirely.
xStream Highlights
Parametric Study Tool
The Parametric Study tool enables rapid and in-depth simulation analysis, allowing users to explore a wide range of input parameters efficiently. By systematically varying inputs, the tool helps identify critical factors affecting system performance, enhancing sensitivity analysis and optimization. Engineers can gain clear insights through graphical trends, even in cases where traditional goal-seeking methods struggle. This approach facilitates better decision-making by providing visual justifications for key trade-offs, such as cost versus performance.
xStream Highlights
Graph Annotations
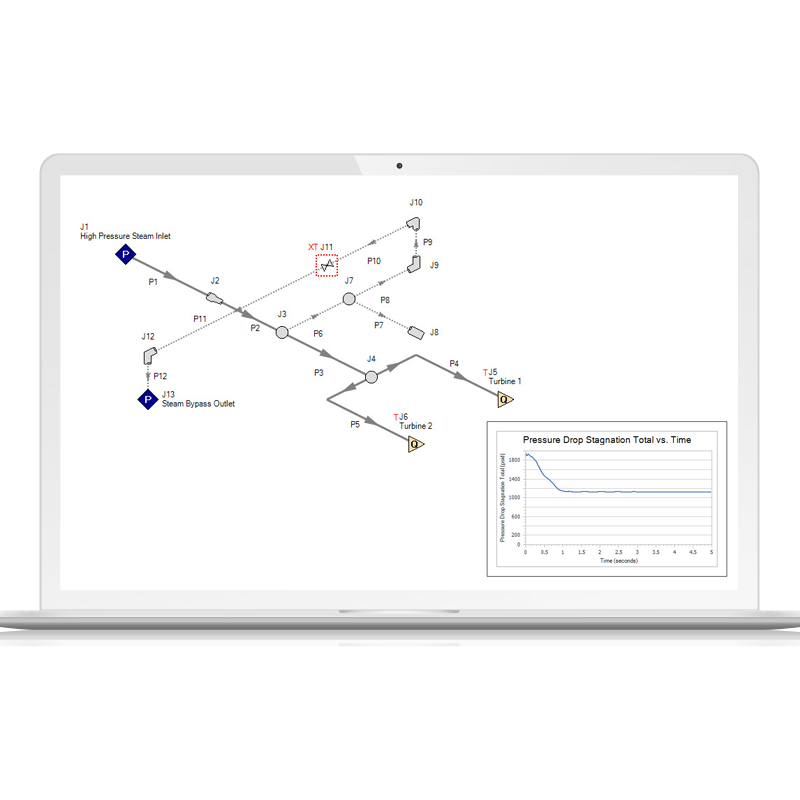
Graph Annotations is a new feature designed to enhance modeling workflows by allowing users to add auto-updating graphs directly to their Workspace. These graphs provide instant insights by visually comparing model results without requiring users to navigate elsewhere. Fully resizable, movable, and easily hidden, they function like Color Map layers, updating automatically based on Output data. By bringing the capabilities of the Graph Results tab to the Workspace, this provides a streamlined approach to reviewing key data, improving efficiency and decision-making.
xStream Highlights
Design Alert Layer
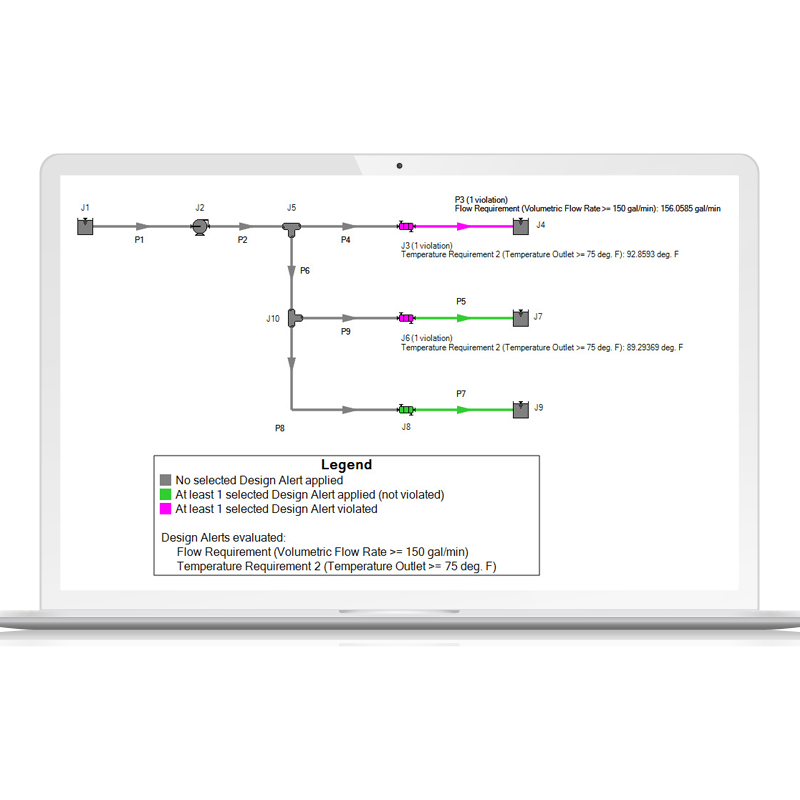
The Design Alert Layer is a new feature designed to enhance model performance visualization and analysis. It provides color-coded indicators on the Workspace to highlight objects that have violated Design Alerts. Each affected object is labeled with the specific condition and evaluated value, eliminating the need for manual checks. This feature streamlines model analysis by identifying and highlighting areas of the Workspace that are exceeding user-set system requirements.